Use tradely
most advanced
features.
- Import daily reports from your trading platforms.
- Analyze your trading strategy.
- Outperform yourself learning from your experience.
- Join trading communities and compare your performance to others'.
- Share your progress in social networks.
Compatibility


Features
Dashboard Overview
Visualize your trading performance through intuitive charts and access key statistics to make informed decisions.
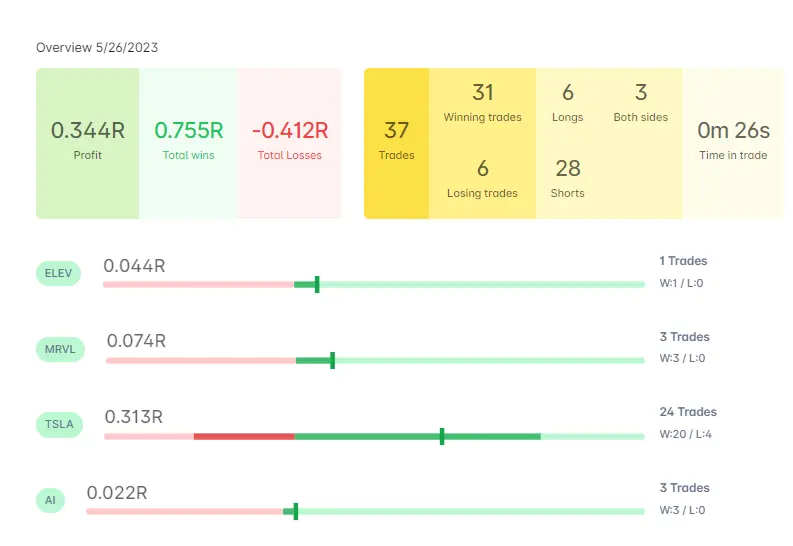
- Profit and loss balance visualization
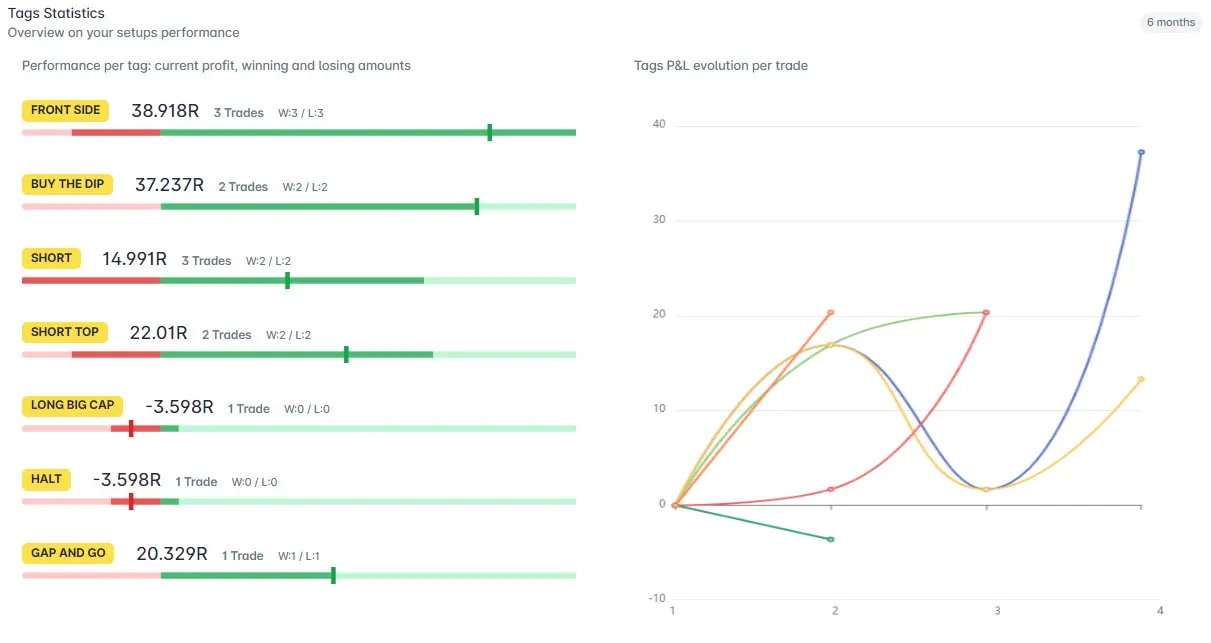
- Statistics per tag for outcome analysis
- Identify top stock winners and losers
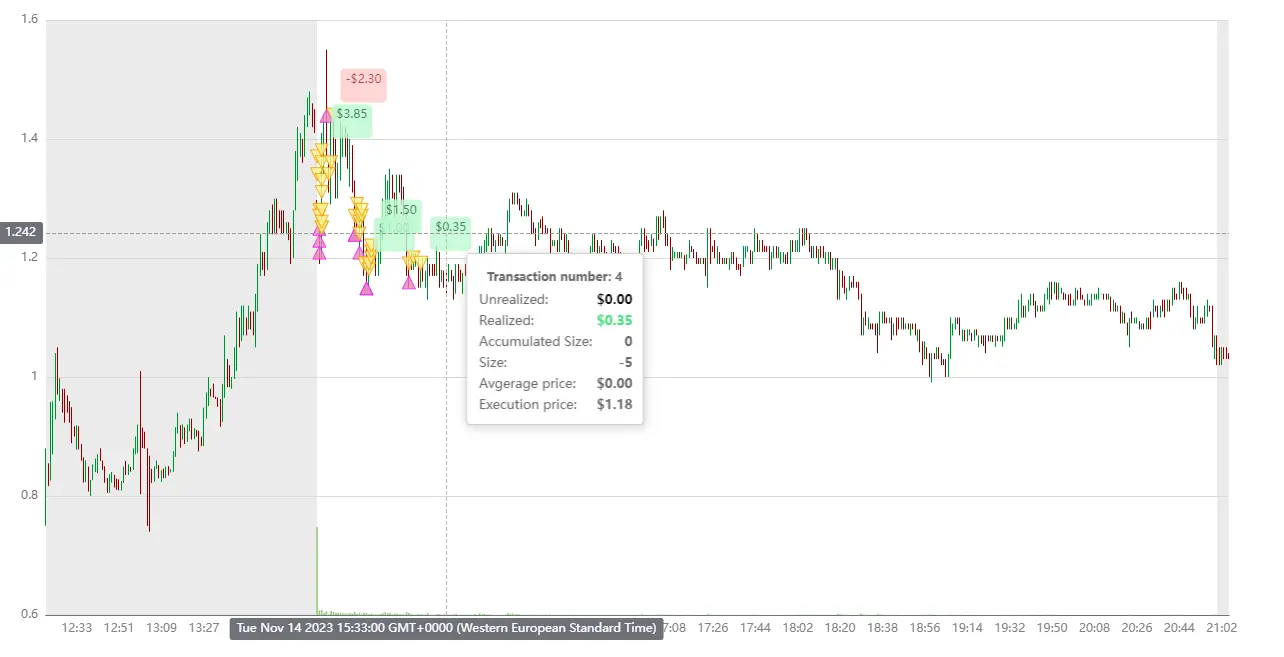
Candlestick Chart
Enhance your analysis and reflection with this interactive tool, making your trade review as insightful as it is effortless.
- Trades accurately displayed in chart
- Comment and tag each trade from chart
- View trade executions and floating statistics
Performance Calendar
Our Calendar feature offers a comprehensive view of your daily profits at a glance. With a simple click on any date, a detailed modal springs to life, presenting you with the trades that shaped your day. This seamless integration of data and dates ensures you never miss a beat in your trading history.
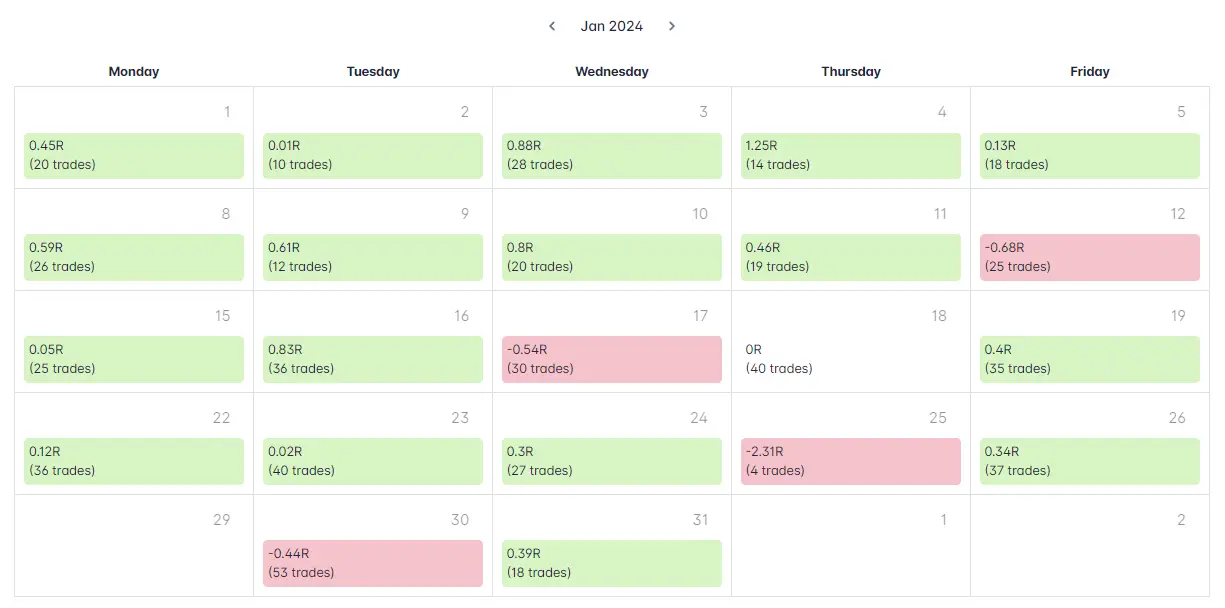
- View calendar results in risk based
- Daily overview for each day
Trade Visualization & Management
Get the best setups statistics by tagging your trades. Explore trades and transactions with comprehensive charts, annotate them for future reference, and perform advanced searches.
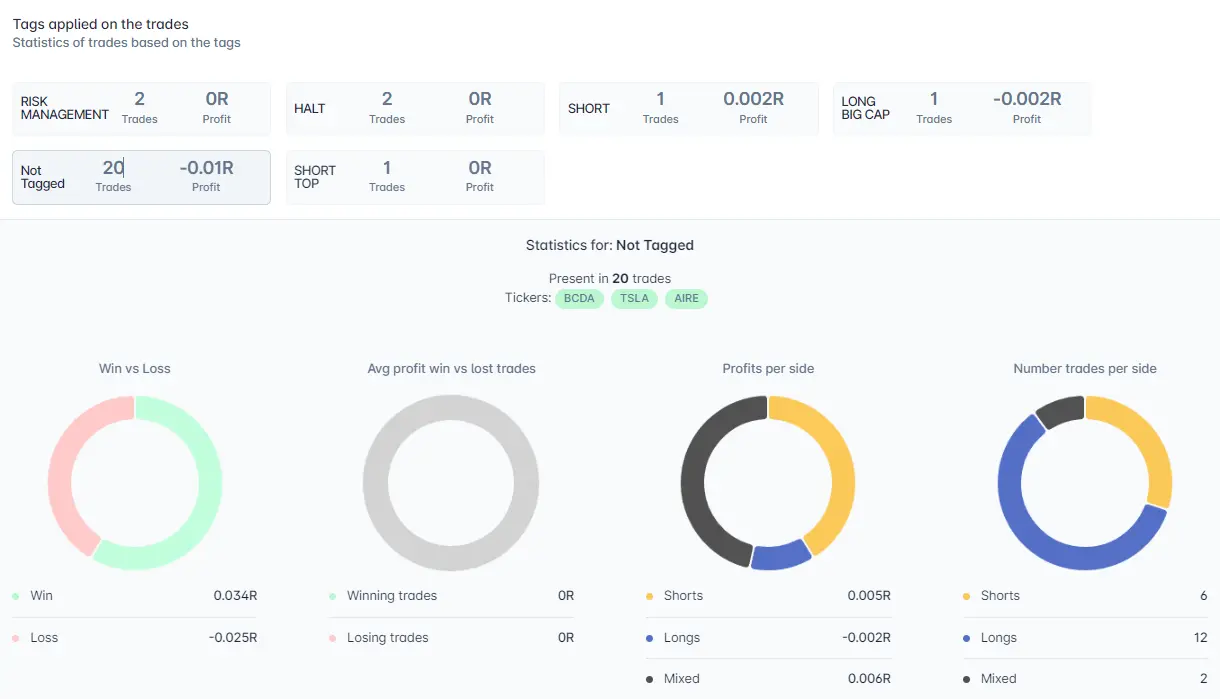
- Tag and annotate trades for better organization
- Advanced search with filters such as profit/risk, tag, and dates
Statistics using Risk/Reward as a metric
Analyze your performance based on the Risk/Reward. Using R as a metric allows you to compare your historic results regardless the profit in FIAT
- Keep track on your risk/reward evolution
- Easily comapre your performance with other trades on a same metric
- Keep your profits in FIAT private while sharing your results based on R
Risk Management Tools
Optimize your trading strategy with built-in risk analysis tools. Analyze and manage the risk associated with your trades to improve your risk/reward ratio.
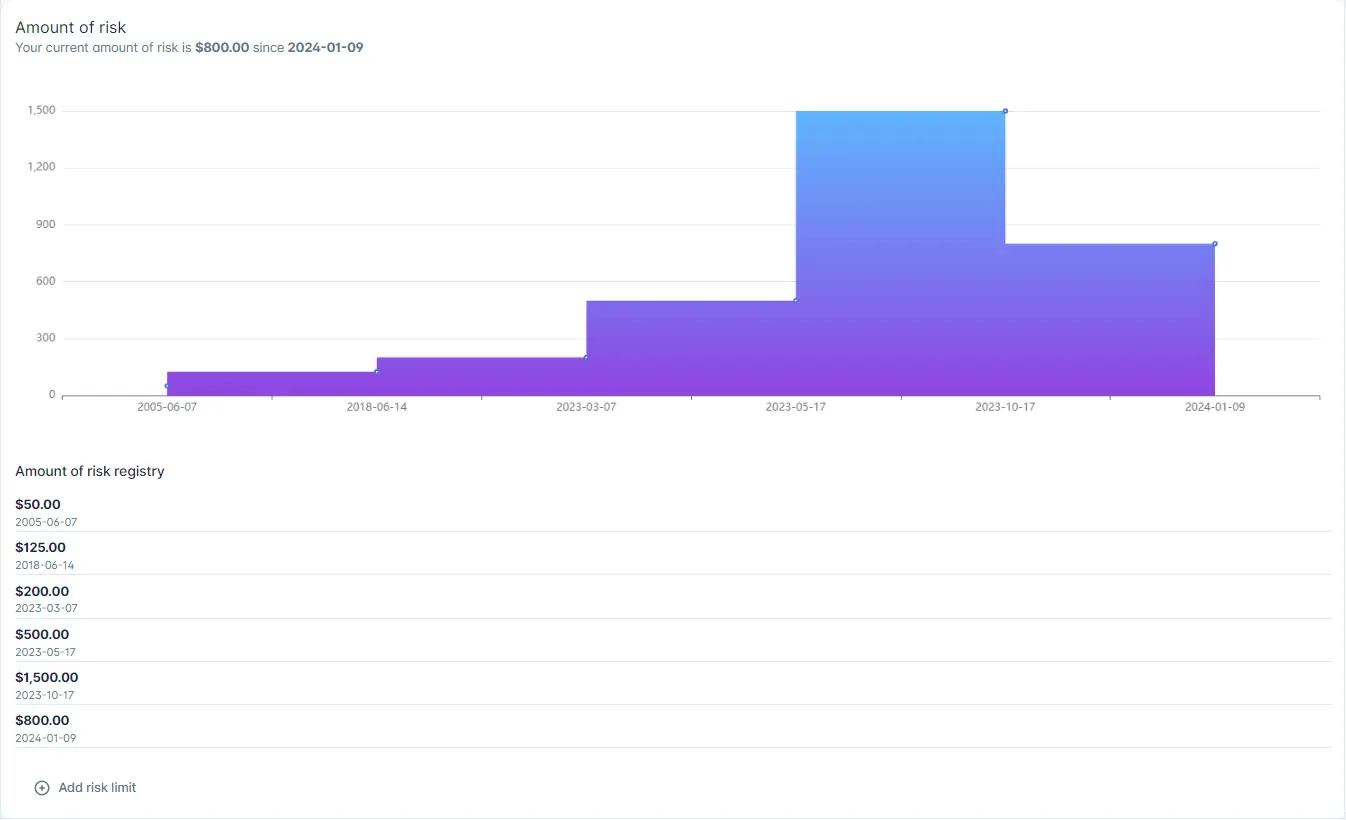
- Analyze and manage trade risk
- Suggestions for improving risk/reward ratio
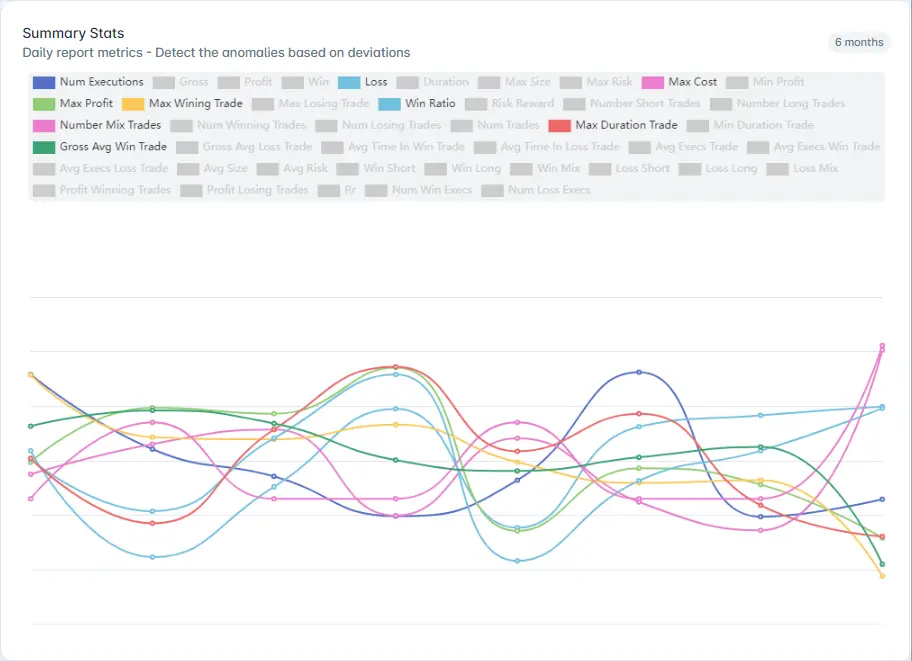
Divergences
Compare various trading parameters for detecting anomalies or irregularities that could lead to losses.
- Identifies trades outside the normal range, highlighting potential red flags.
- Evaluates execution efficiency and identifies areas for improvement.
- Standard deviation is one part of a broader, more robust analytical toolkit.
- Uncovers the interplay between different trading factors.
- Validates strategies by applying findings to historical data.
Transform Your Trading Journey
Stop wondering how to improve your trading skills and unlock your potential
Import your first daily report in less than a minute.
Use comprehensive charts to evaluate your strategies.
Connect with other traders and compare performances.
Share your results with the world in social networks.
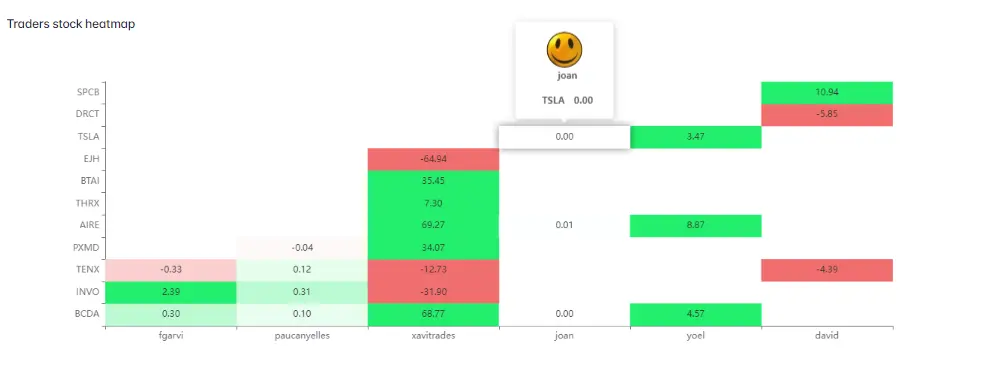
Community & Social Sharing
Learn from your experience, but also from others. With communities, you can compare your trades to other members and see how successful traders performed in the same market operations.